
Winnebago Industries (WGO) - Bull Thesis
Company Poised for a Rebound in a Cyclical Industry


Executive Summary
Investment Thesis
Cyclical Recovery: Winnebago (WGO) is a premium RV manufacturer operating at depressed earnings due to slowing consumer demand due to high interest rates. Normalization of financing costs should drive a strong rebound.
Operational Leverage: WGO has expanded margins historically and demonstrated >30% incremental margins even in a weak demand environment, positioning it to outperform in recovery.
Diversification & Growth: Acquisitions in marine (Barletta, Chris-Craft) provide diversification beyond RVs and long-term growth optionality.
Valuation
Base Case (FY2026E): $52/share (+53%).
Bull Case: $120/share (+260%).
Bear Case: $34/share (flat).
Current valuation (~7.5x normalized EV/EBITDA) sits near the low end of its historical range and at a discount to peers on EV/Sales.
Catalysts
Federal Reserve rate cuts improving RV affordability.
Operational Leverage & Incremental Margins
Marine segment expansion and incremental margin recovery.
Recommendation
BUY: WGO offers attractive asymmetric upside leverage to a U.S. consumer recovery, with a favourable risk/reward profile.
Company Overview and Industry Context
Winnebago Industries (NYSE: WGO) is a U.S.-based manufacturer of recreational vehicles and marine products headquartered in Eden Prairie, Minnesota. Its core brands include Grand Design RV, Newmar, Barletta, Chris-Craft, and ATG. WGO distributes through a network of 400+ dealers across North America, with a limited European presence. The company employs ~5,700 people and has been led by CEO Michael Happe since 2016.
Core Business Segments
Revenues are primarily generated through three categories: Towable RVs, Motorhome RVs, and Marine. Towables include Fifth Wheel and Travel Trailers, while Motorhomes comprise Class A, B, and C vehicles.
Over the last 10 years here is the breakdown of each segment as a percentage of Net Revenue and Adjusted EBITDA.
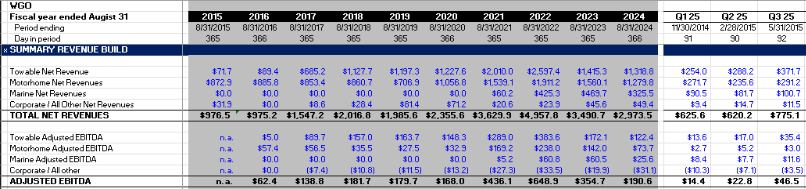
Towables further break down to the following segments:
Fifth Wheel
Travel Trailer
Motorhomes further break down to the following segments:
Class A
Class B
Class C
Market Positioning
There are three key manufacturers in the United States in the RV industry. Thor Industries, Forest River and Winnebago Industries. Thor is the largest player with the largest earnings and most scale. Forest River is the second largest, focused mainly on entry-level and affordable RVs; it is owned by Berkshire Hathaway. Winnebago is the third largest player with around 12% market share and focuses on premium and mid-market RVs and towables.
Is This a Good Business?
CAGR of Revenues and EBITDA
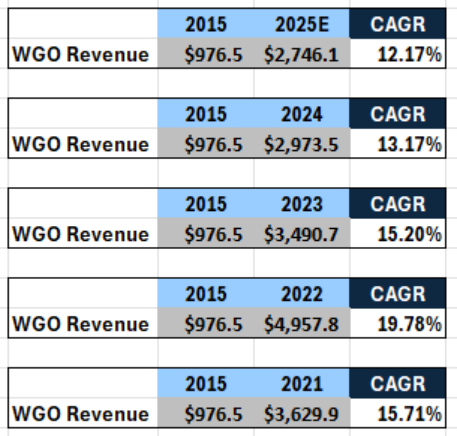
From 2015 to 2024 WGO achieved a 13% CAGR. Low teens is a good, not amazing but good, especially for the industry that has a CAGR of 5%. At the same time WGO went from around 3-12% market share by both acquisitions and organic growth.
Interest Rate Sensitivity
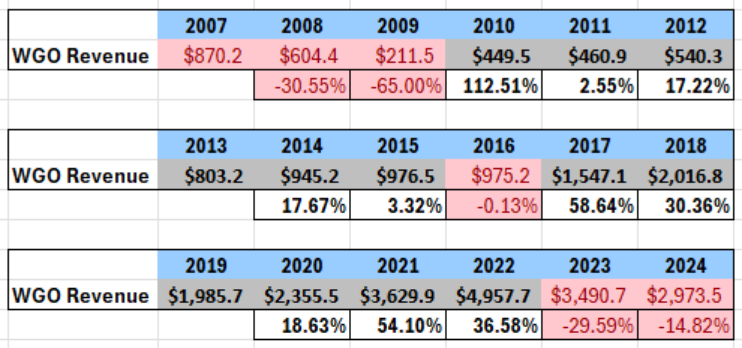
The drawback of WGO is the high degree of economic sensitivity. In the 2008 financial crisis WGO revenues declined 30% and 65% consecutively. In 2023, as high interest rates started putting pressure on the US economy revenues declined 30% and 15% in 2024.
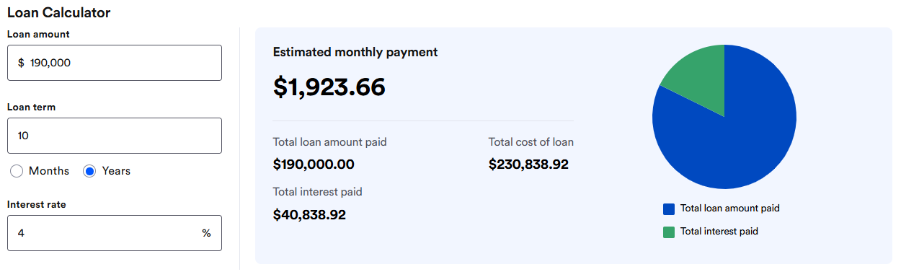
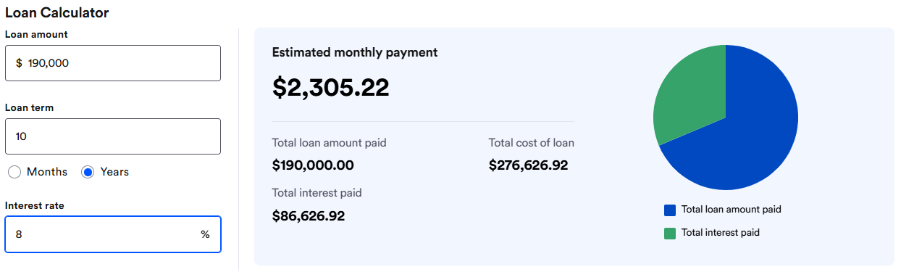
The current interest rates are putting immense pressure on the WGO bottom line by depressing demand. WGO also has a high financing sensitivity. 70-80% of RVs are financed so high interest rates kill demand. WGO ASP for motorhomes is $190,000, at 4% interest financing rate monthly payments are $1,924 and with 8% interest rate interest paid doubles and monthly payments go up 20% to $2,305.
Profit Margins
Net income has been growing and experienced a meteoric rise in FY 2021 and 2022. Net income margins hover in the mid-single digits but in 2024 they came in at 3.4%.
EBITDA margins are in high single digits, although in 2021 and 2022 EBITDA margins were in low double digits. In 2024, EBITDA margins have fallen all the way down to 6.2%.
Summary on WGO (is this a good business)
Overall, WGO is a good business. The business has been growing its revenues, improving margins, increasing market share both organically and through acquisitions. In 2021 and 2022 margins, profits and ROIC were spectacular but that is unlikely to repeat themselves in a sustainable way. The downside on WGO is that it is highly cyclical and economically sensitive.
How Does the Business Make Money?
First thing to remember is that WGO is a manufacturer, not a dealer. When dealer places an order, it goes into the WGO’s backlog. Sale to dealer in made on cash terms, but with a repurchase agreement if the unit cannot be sold. The revenue is recognised when unit is delivered to the dealer.
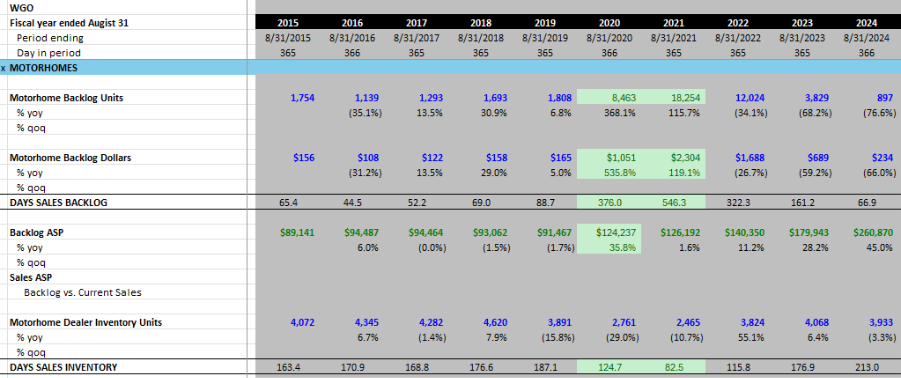
This means that the backlog matters, dealer inventory levels matter. As you can observe from the photo below the last time WGO stock hit ATH was when dealer inventory levels and day sales inventory were at the lowest point in the last 10 years indicating strong demand from consumers and thus dealers. This pushes up orders from the dealers thus backlog and days sales backlog and ASP, which grew margins.
Unfortunately, after 2024 WGO has stopped reporting these figures in their filings, but I can present the latest data available QoQ:
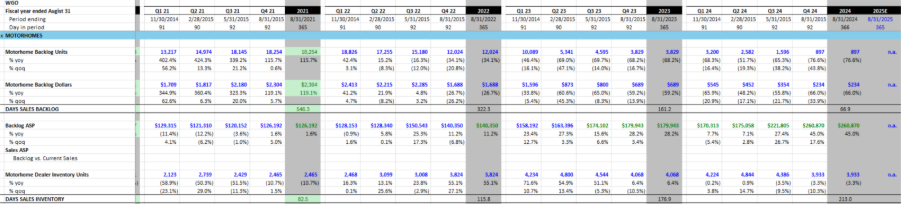
Backlog units have been falling as dealers overbought in 2020–2021 during the boom and are still working through stock. On top of that there is no need for dealer to put it large orders as demand is weak. Although, the inventory units have since stabilised and are not really changing; they’re hovering around 4,000 units.
Let’s look at unit economics
The following is calculated by dividing total revenue by total unit deliveries. It is useful to know but it’s quite blunt.
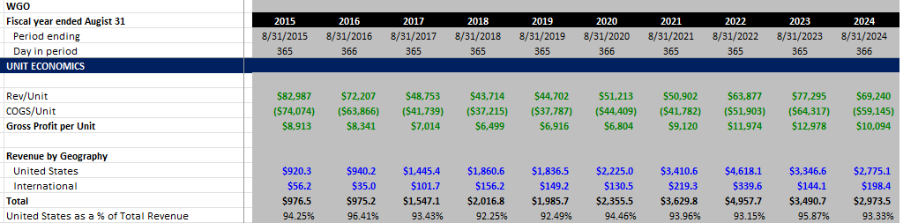
As you can see each year, over the last 10 years WGO has generated 95% total revenue in the United States. There is no trend to follow and no reason to believe international revenues will grow as a percentage.
Most profitable segment
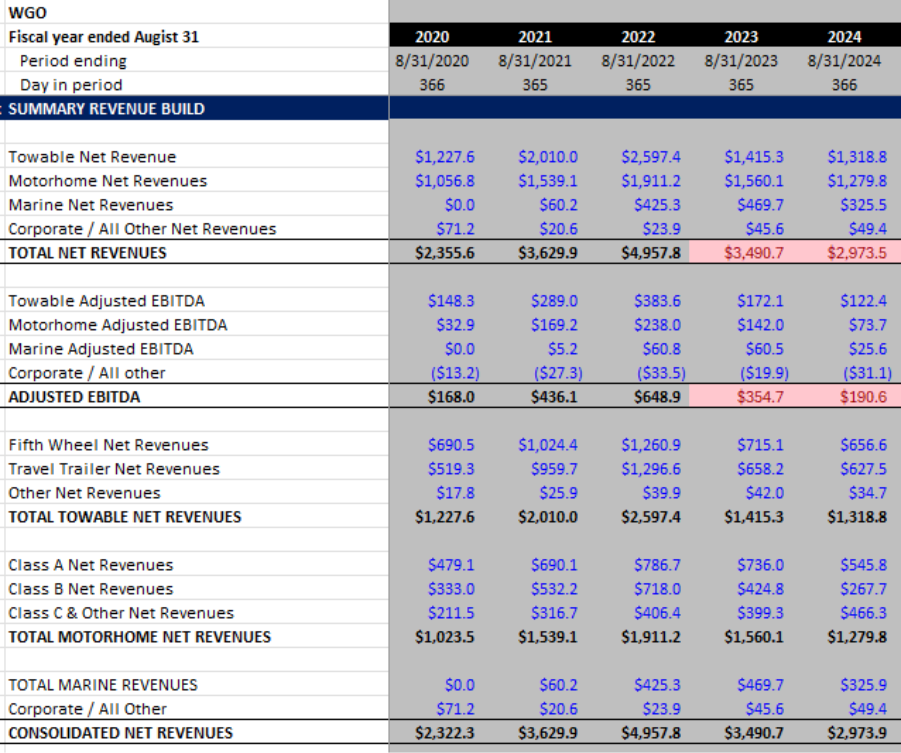
Historically, towables and motorhomes have driven 85-95% of total net revenues. This percentage has fallen to 85% in the last FY ‘24 as marine and other revenues rise. But main value creation is done though these two segments.
Diving deeper into the towables, net revenues are distributed 50%-46% for Fifth Wheel net revenues and Travel Trailer Net revenues, remaining 4% is from other net revenues. With net revenues from the motorhome sales, historically Class A has contributed the most followed by Class B and then Class C.
To conclude the most profitable segments historically from the towable side is Fifth Wheel and from the motorhome side its Class A. These segments really drive large percent of the net revenues. For the past 7 years on average these two segments combined have accounted for 45% of total net revenues.
So, what drives the business?
Backlogs matter. Dealer inventories level matters.
Tight backlogs and low inventories drive high pricing. High pricing drives high gross margins.
High gross margins drive high earnings and FCF.
Key drivers:
Unit demand: Driven by customer demand, which is driver by the economy.
Unit pricing: Driven by backlog, unit demand and competition (or lack of it)
Margins: Driven by unit pricing, which is driven by unit demand and customer demand.
Momentum and Cost Structure
Evolution of operating cost structure of Winnebago over the last 10 years.
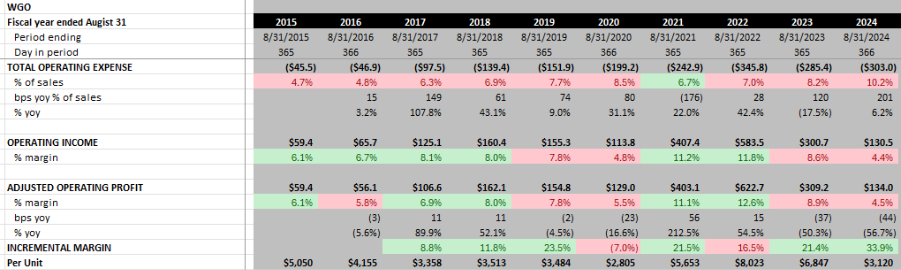
WGO’s operating expenses as a percentage of sales increased from mid-single digits to ~10.2% in FY2024. The momentum has been very poor over the last 10 years. Operating profit margin varies between mid-to-high single digits. Although, in 2024 WGO has produced the lowest operating profit margin for the last 10 years. So, momentum on those two metrics is poor, and it is expected to be, the stock price reflects the current struggles. The metric that I am impressed with is incremental margin. In 2023 and 2024, incremental operating profit margins have been 21.4% and 33.9% respectively. This signals operational efficiency improvements which are very impressive. FY 2024’s 4.5% operating profit margin can be attributed to higher overhead costs and the slump in sales due to the economy. This margin should expand at least to 7% (historical) as orders pick back up. This makes me believe that WGO is well positioned to benefit greatly from the next pickup in sales, with expanded margins.
ASPs for Towables
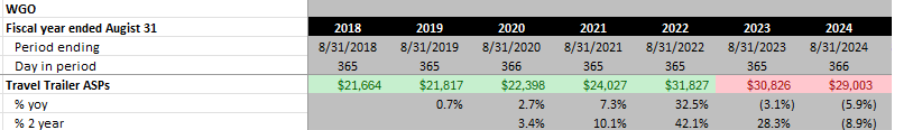
There is a clear difference between the towable ASPs and the motorhome ASPs. As towable ASPs have fallen over the last couple years, the RV prices have been more resilient, and in the case of Class B ASP growing 6.4% YoY. Clearly, WGO has more pricing power in motorhomes than in towables.
ASPs for Motorhomes
Some History
During the Covid-19 from 2020 into 2022 the stock price tripled from $25 to over $75. This was driven by people having the freedom to work from home and choosing to buy RVs, travel and work from there. This trend was a huge tailwind for the RV industry and trickled down to WGO income state and balance sheet with unprecedented profits and huge backlog of orders from dealers.
Post-Pandemic Slowdown
The music stopped when COVID restrictions eased and employers called workers back, the pandemic pull-forward unwound. Rising Fed funds rates pushed up financing costs, depressing consumer demand and driving a sharp decline in WGO’s earnings and industry profits.
Recent Headwinds
While there are signals of recovery, recent headwinds have really beaten the Winnebago stock down. The main issue is that the RV industry is depended on the good performance of the US Economy, especially since Winnebago focuses of more premium and mid-market segment. The struggles of the US economy and the high Fed rates have depressed demand for RVs.
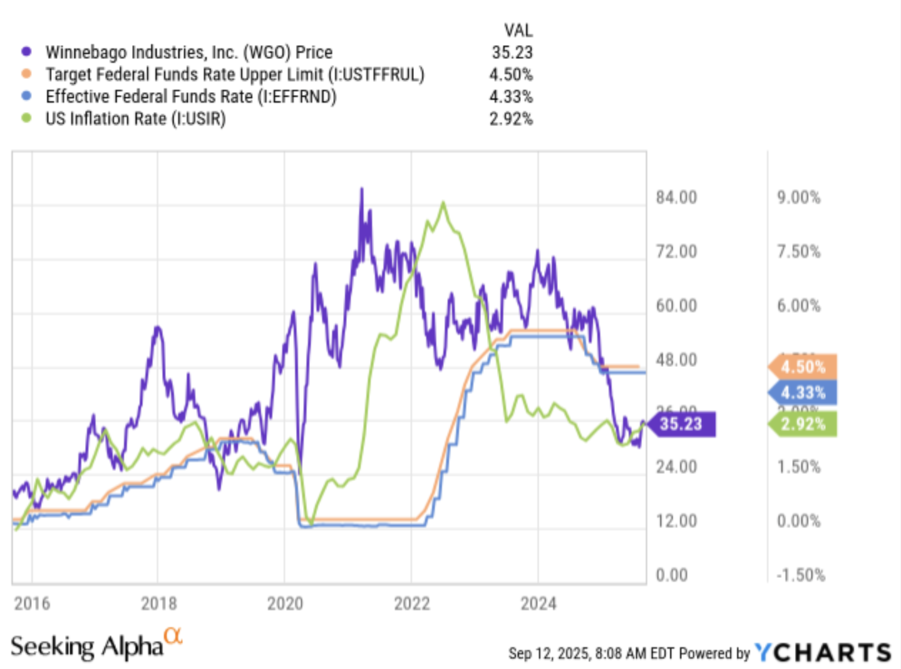
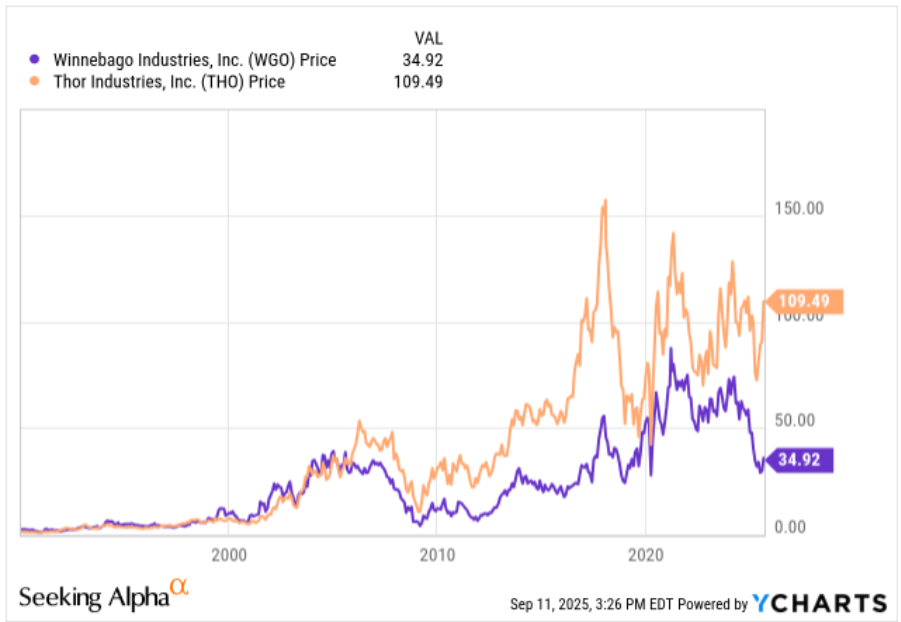
As we can observe, from the chart above as the interest rate peaked and inflation came down WGO stock started to collapse.
Valuation
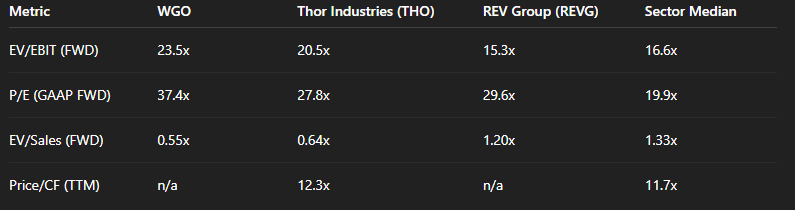
WGO trades at a discount to peers on EV/Sales and EV/EBITDA, but at a premium on P/E because near-term earnings are depressed. This reflects cyclical trough conditions investors are looking through the current earnings compression
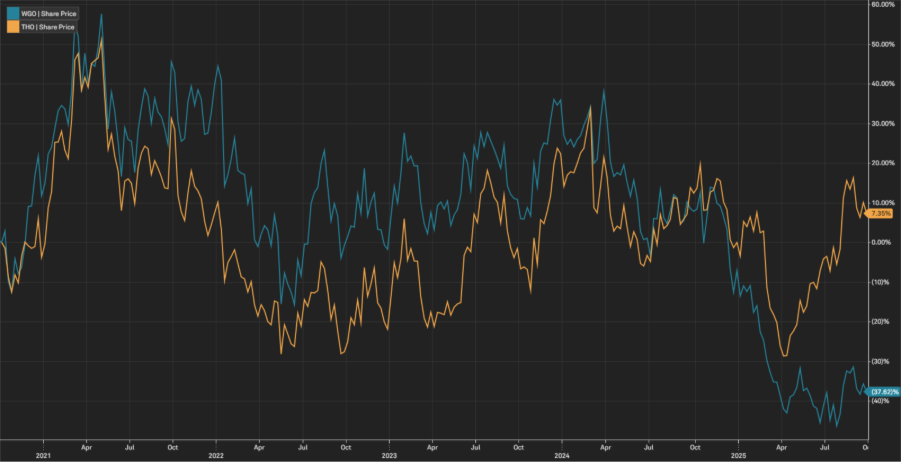
Currently there is a price divergence between THO and WGO which presents an opportunity for a mean reversion.
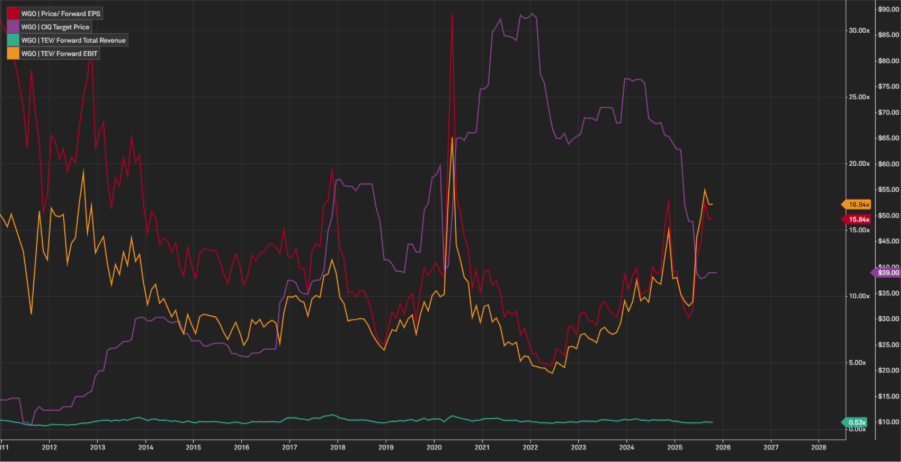
Valuation historical Context
Valuation metrics while not at the bottom are sitting in attractive ranges. Over the past 10 years, WGO has historically traded in the range of 6–12x forward EBITDA and 10–18x forward earnings. Today’s implied EV/EBITDA (~7.5x on normalized FY2026E EBITDA) sits at the low end of its historical band, while the high P/E reflects trough EPS rather than structural overvaluation.
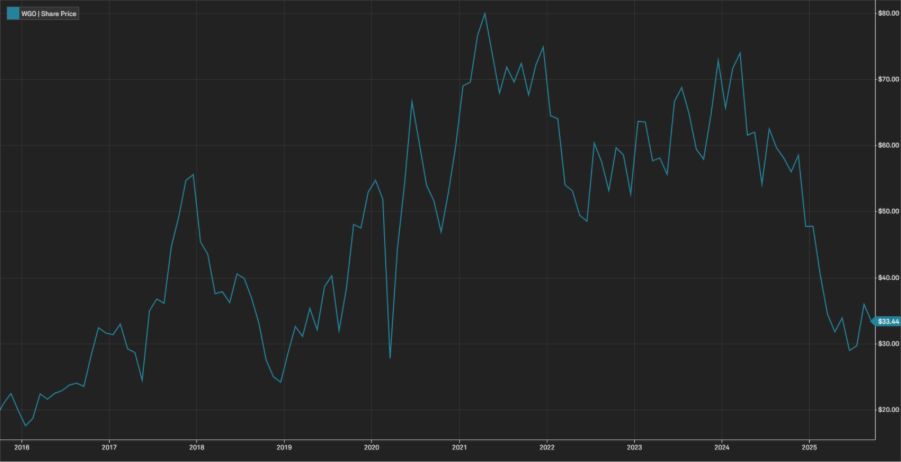
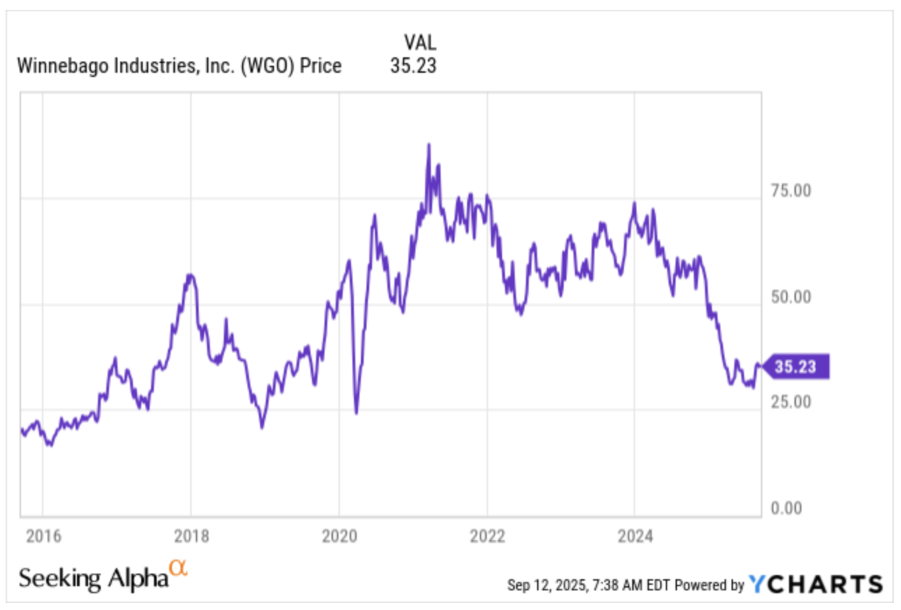
52-week range: $28.00–$65.65; shares currently at $33.51, an attractive historical level.
Risks to the Turnaround
Economic Sensitivity
RVs are highly discretionary purchases. A prolonged U.S. economic slowdown, higher unemployment, or weaker consumer confidence could delay recovery and depress unit demand.
Interest Rate Risk
If inflation remains sticky and rates stay elevated longer than expected, affordability constraints would continue to suppress sales. Every 100 bps increase in rates raises monthly RV financing costs ~10%.
Competitive Pressure
Thor Industries and Forest River (Berkshire Hathaway) possess greater scale. Aggressive discounting from larger peers, especially in towables, could cap pricing power and pressure margins.
Consumer Behaviour Shifts
The COVID boom created a temporary pull-forward of RV demand. If structural consumer appetite for RV ownership is lower post-pandemic, the industry’s long-term growth rate may reset downward.
Investment Recommendation
Base Case (FY2026E)
Revenues recover to ~$2.93B (mid-cycle).
EBITDA margin expands back to ~9% (from 6.2% in FY2024).
EBITDA = ~$264M.
Apply 8.0x EV/EBITDA (historical mid-point).
TEV = ~$2.1B.
Subtract net debt (~$600M) → Equity = ~$1.5B.
Implied price = $52/share (+53%).
Bull Case
Faster demand recovery, revenues $4.5B, EBITDA margin 10%.
EBITDA = $450M. Apply 9.0x multiple.
TEV = ~$4.1B → Equity = ~$3.5B.
Implied price = $120/share (+260%).
Bear Case
Prolonged weak cycle, revenues flat at $3.2B, EBITDA margin 7%.
EBITDA = $225M. Apply 7.0x multiple.
TEV = ~$1.6B → Equity = ~$1.0B.
Implied price = $34/share (flat).
Catalysts
Federal Reserve Rate Cuts
With 70–80% of RVs financed, affordability is highly sensitive to interest rates. A 100 bps cut could lower monthly payments on a $190K motorhome by ~10%, materially improving demand. Any clear Fed guidance on a cutting cycle would be a direct positive catalyst for WGO.
Marine Segment Expansion
The Barletta and Chris-Craft brands give WGO exposure to the marine market, which is less saturated and offers long-term growth optionality. Continued growth here diversifies earnings away from RV cyclicality.
Operational Leverage & Incremental Margins
WGO demonstrated >30% incremental margins even in a weak demand environment. As volumes recover, operating leverage should magnify earnings power, driving a faster rebound in profitability than revenues alone suggest.
Conclusion
Winnebago (WGO) is a high-quality cyclical business that has expanded market share and improved operational efficiency over the last decade. Today, the company faces cyclical headwinds from high interest rates and elevated dealer inventories, which have compressed earnings and left the stock optically expensive on near-term P/E. However, on normalized mid-cycle metrics WGO trades near the low end of its historical EV/EBITDA range and at a discount to peers on EV/Sales, offering an attractive entry point.
Catalysts for re-rating include Fed rate cuts improving RV affordability, dealer inventory normalization, and incremental margin recovery, while risks remain around macro weakness, consumer demand, and competition. Scenario analysis points to a base-case fair value of $52/share (~53% upside) with a favourable skewed risk/reward.
Recommendation: BUY: WGO offers compelling upside leverage to a cyclical recovery in U.S. discretionary spending.